Service graphs
Graph Information
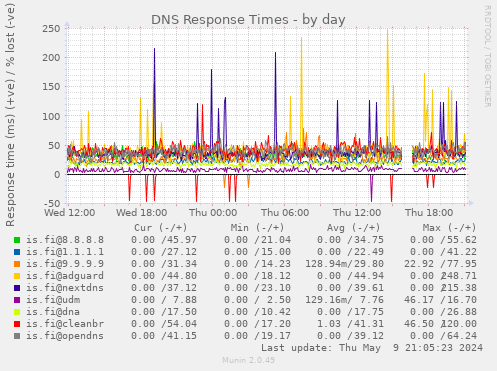
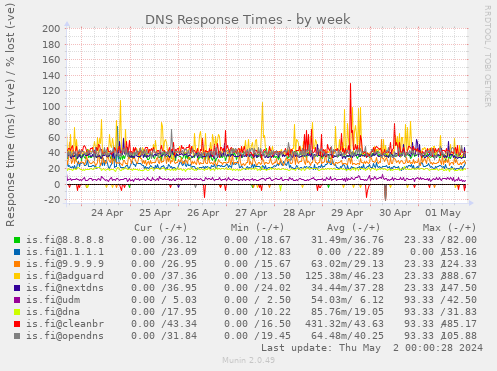
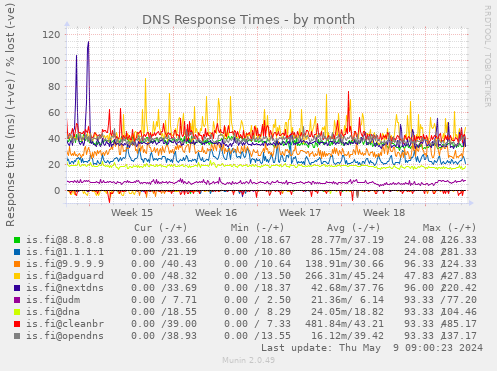
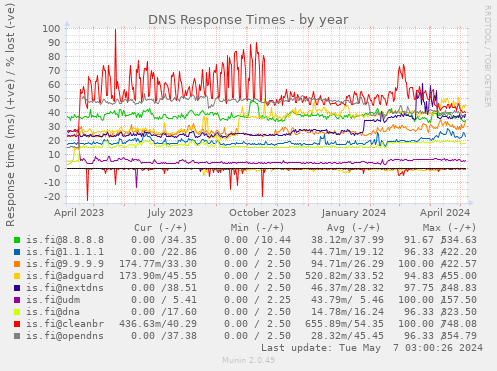
This plugin monitors DNS response time. A single look-up for the target domain is sent and the time to get a valid response is shown in milliseconds. The query is sent to the default resolver for this host, or to the specified IP shown after the @ in the label. The query timeout is 1 seconds.
| Field |
Internal name |
Type |
Warn |
Crit |
Info |
| [email protected] |
time0 |
gauge |
|
|
DNS response time for [email protected] |
| [email protected] |
time1 |
gauge |
|
|
DNS response time for [email protected] |
| [email protected] |
time2 |
gauge |
|
|
DNS response time for [email protected] |
| is.fi@adguard |
time3 |
gauge |
|
|
DNS response time for is.fi@adguard |
| is.fi@nextdns |
time4 |
gauge |
|
|
DNS response time for is.fi@nextdns |
| is.fi@udm |
time5 |
gauge |
|
|
DNS response time for is.fi@udm |
| is.fi@dna |
time6 |
gauge |
|
|
DNS response time for is.fi@dna |
| is.fi@cleanbr |
time7 |
gauge |
|
|
DNS response time for is.fi@cleanbr |
| is.fi@opendns |
time8 |
gauge |
|
|
DNS response time for is.fi@opendns |
| is.fi@controld |
time9 |
gauge |
|
|
DNS response time for is.fi@controld |
| is.fi@nwps |
time10 |
gauge |
|
|
DNS response time for is.fi@nwps |