Service graphs
Graph Information
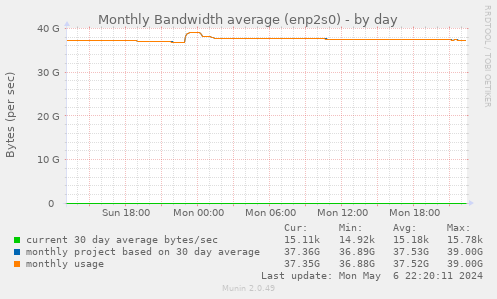
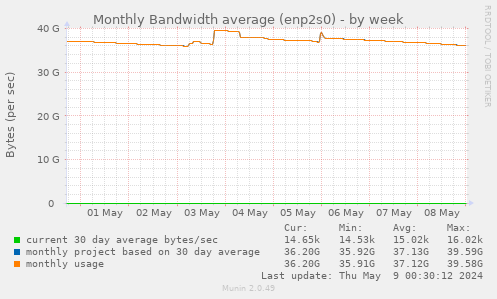
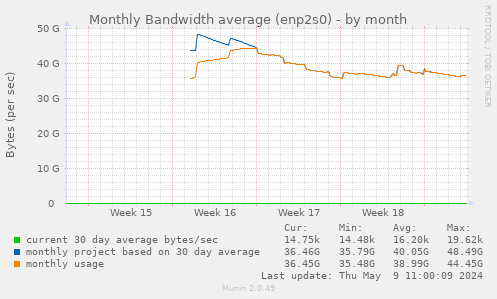
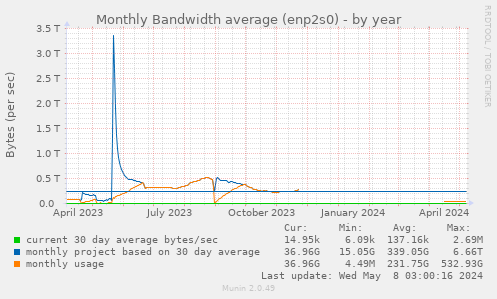
This graph show your current average bandwidth usage and projected 30 day average based on your last 30 day usage.
| Field |
Internal name |
Type |
Warn |
Crit |
Info |
| current 30 day average bytes/sec |
average |
gauge |
103563.061728395 |
|
Your average network rate based (up to) the last 30 days of data |
| monthly project based on 30 day average |
monthly |
gauge |
268435456000 |
|
Your projected monthly network rate based on your average network rate |
| monthly usage |
_0dayusage |
gauge |
268435456000 |
|
Your usage for the last 30 days. |