Service graphs
|
|
|
|
Graph Information
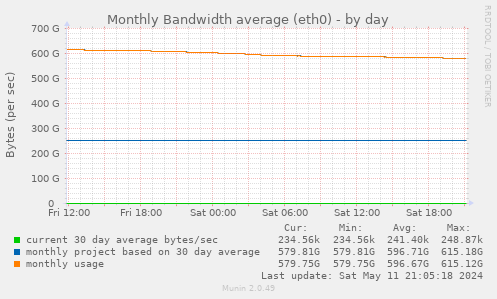
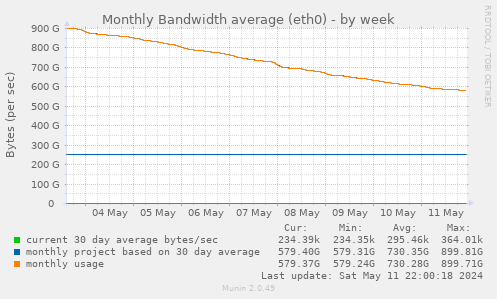
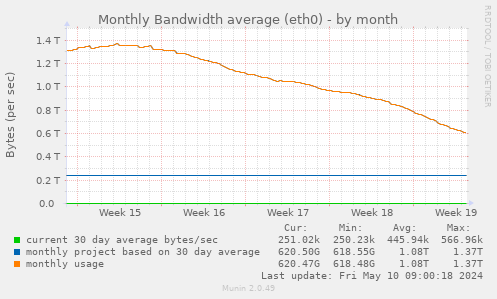
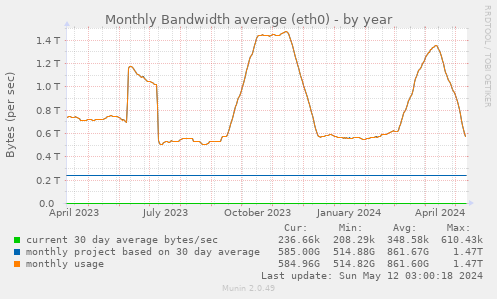
This graph show your current average bandwidth usage and projected 30 day average based on your last 30 day usage.
Note: This service is in WARNING state because one of the values reported is outside the allowed range. Please see further down for information about the ranges and the graph for the values.
| Field | Internal name | Type | Warn | Crit | Info |
|---|---|---|---|---|---|
| current 30 day average bytes/sec | average | gauge | 103563.061728395 |
Your average network rate based (up to) the last 30 days of data | |
| monthly project based on 30 day average | monthly | gauge | 268435456000 |
Your projected monthly network rate based on your average network rate | |
| monthly usage | _0dayusage | gauge | 268435456000 |
Your usage for the last 30 days. |